
The Bottom Line
Pros
- + In socket upgrade
- + Efficiency (Performance per Watt)
- + Pricing / Value
Cons
- - No real gain in IPC
Should you buy it?
AvoidConsiderShortlistBuyIntroduction and Pricing
Coming off the flagship Core i9-13900K and digging into Intel's entry into 13th Gen Raptor Lake, the Core i5-13600K offers sizeable improvements over the Alder Lake 12600K. Most notable is the core count, with E cores doubling from four to eight and maintaining the same six performance cores. Base clock speeds on the P cores have changed from 3.7GHz to 3.5GHz and 2.8GHz to 2.6GHz on the E Cores.
On the other hand, boost clocks have gone up from 4.9GHz on the 12600K to 5.1GHz on the 13600K; the same is found on the E cores, going from 3.6GHz to 3.9GHz. Cache is another sizable change in the move to 13th Gen, L2 cache doubling on the 13600K, from 9.5M on the 12600K to 20M on the 13600K, and L3 Smart Cache has moved from 20M to 24M.
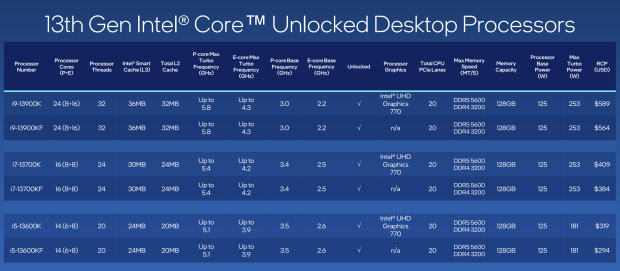
Further specifications can be found in the image above. These include the iGPU, still the UHD 770, though its clocks, too, have been increased a few hundred MHz. CPU PCIe lanes have stayed at 20, allowing for support for a full slot GPU and NVMe m.2 solutions. DDR4 and DDR5 are both supported, as this is an in-socket upgrade, and JEDEC supported speeds increased to 5600MHz on DDR5 and 3200MHz on DDR4.
The image above includes all of the launch SKUs for today; these include the 13900K, 13700K, and 13600K, along with their KF iGPUless counterparts. Focusing in this review on the 13600K, pricing comes in at $319.

Core Architecture Updates, Test System, and the 13600K
Architecture Updates
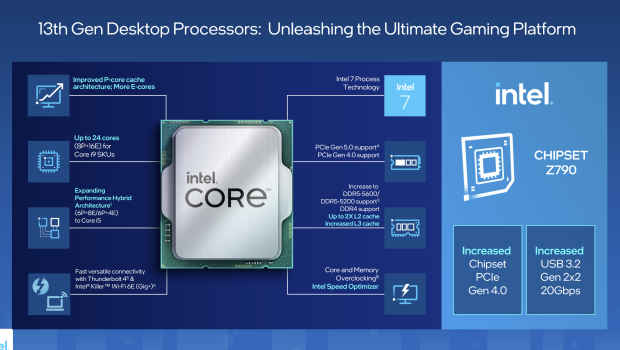
For the 13th Gen, Intel improved the P-Core cache architecture and then added more E-Cores, with most SKUs seeing double the E cores of 12th Gen. At the same time, the motherboard side will see increased chipset PCIe lanes and more connectivity.
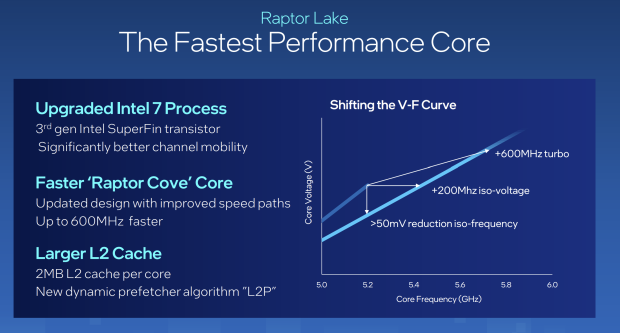
This is Intel's 3rd generation SuperFin allowing for a faster Raptor Cove core. Improvements here allowed for higher boost clocks, some seeing up to 600MHz improvement.
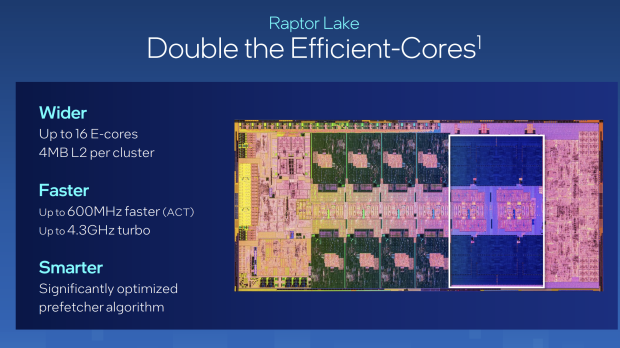
As mentioned previously, E cores have been doubled on some SKUs; the 13600K benefited from this while also grabbing higher boost clocks.
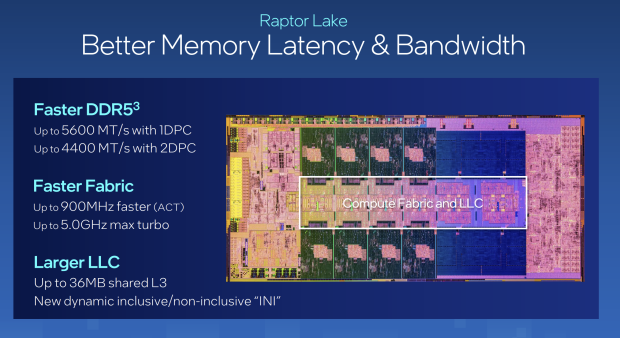
Memory Latency and Fabric, too, have been improved.
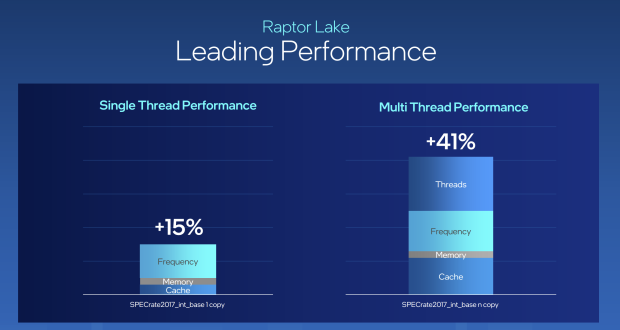
Performance uptakes for Raptor Lake include 15% on Single-threaded workloads and up to 41% on multi-threaded workloads, coming from increased clock speed.
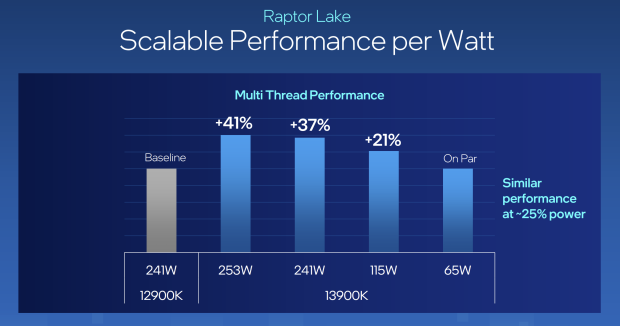
Performance Per Watt is something Intel focused on with Raptor Lake, now showing a 25% reduction in power use at the same performance.
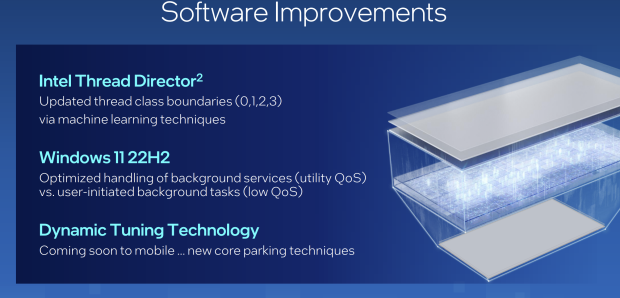
Intel Thread Director, which was introduced with Alder Lake, has recently undergone some updates and is a part of the 22H2 update to Windows 11.
Test System
- Motherboard: Z790 AORUS Master BIOS F1
- GPU: GeForce RTX 3090Ti
- RAM: Corsair Dominator RGB DDR5 6000 CL30
- Cooler: 3x140mm Custom Water
- OS Storage: Sabrent Rocket 4 Plus 2TB
- Power Supply: AORUS GP AP1200PM
- OS: Microsoft Windows 11
Core i5 13600K
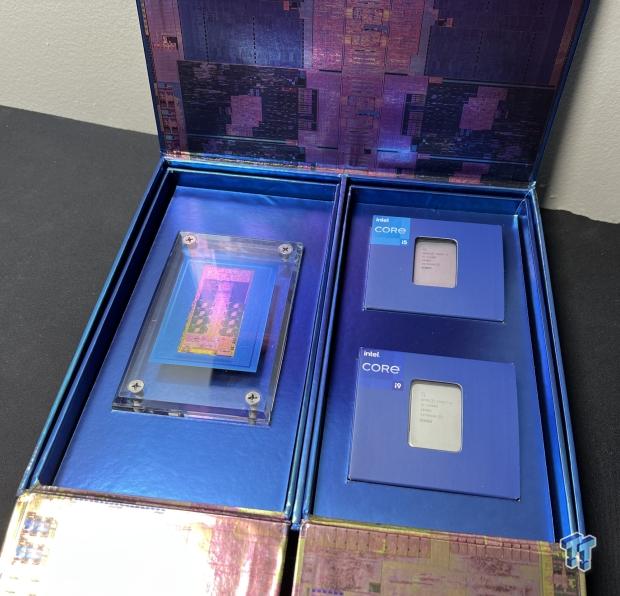
Packaging was media packaging, so there were no retail boxes. Like last year's Alder Lake samples, both the 13600K and 13600K were packed together.
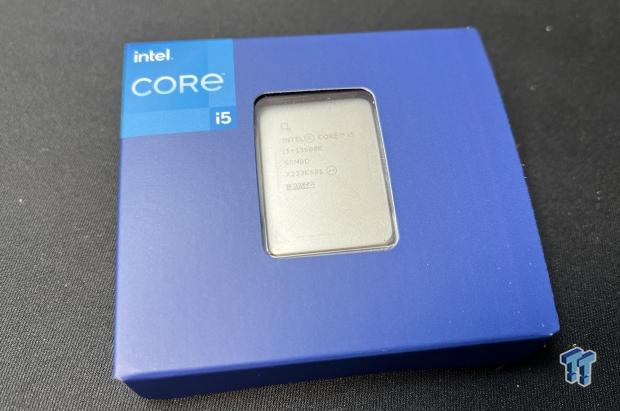
Looking at the 13600K, it too was packaged like the 13900K in its plastic retainer.
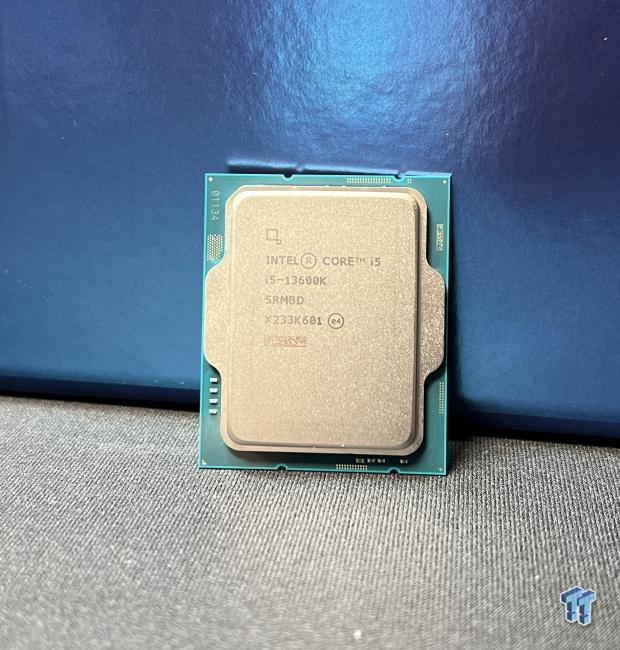
With the CPU unboxed, it's the same form factor as Alder Lake and uses the same LGA1700 socket, and is compatible with current Z690 motherboards.
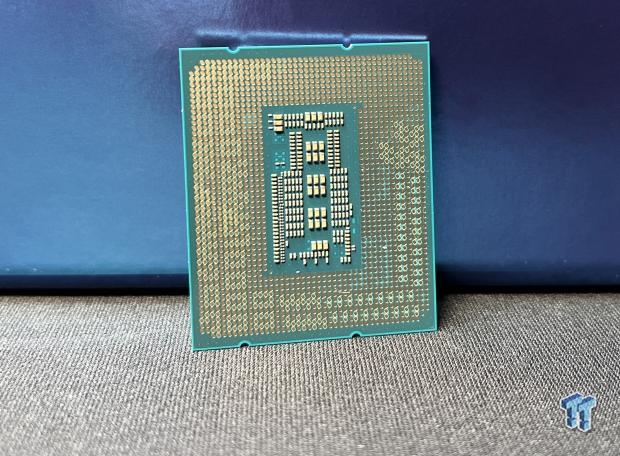
Opposite of AMDs design, Intel has a good amount of SMD on the bottom of the CPU.
Cinebench, Crossmark and AIDA64
Cinebench R23
Cinebench is a long-standing render benchmark that has been heavily relied upon by both Intel and INTEL to showcase their newest platforms during unveils. The benchmark has two tests, a single-core workload that will utilize one thread or 1T, and there is also a multi-threaded test that uses all threads or nT of a tested CPU.
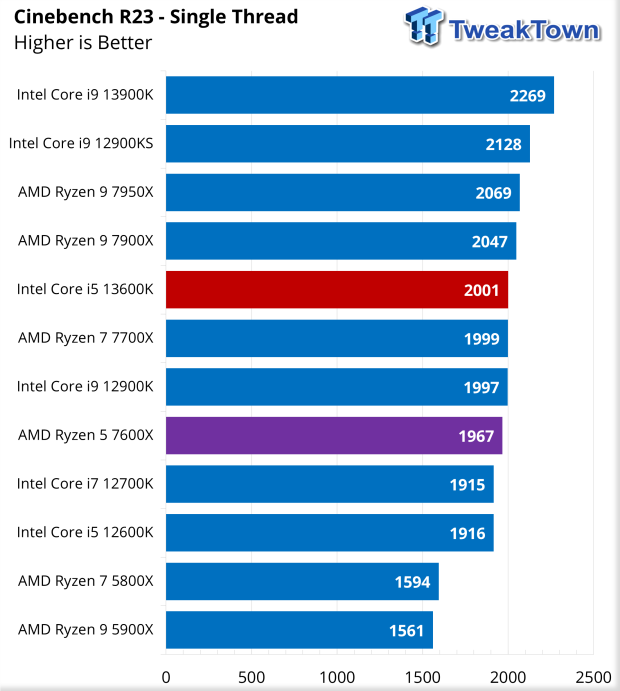
For our 13600K review, I highlighted the 7600x for performance comparison in purple. Our first workload was R23 single thread; the 13600K picked up 2001 points.
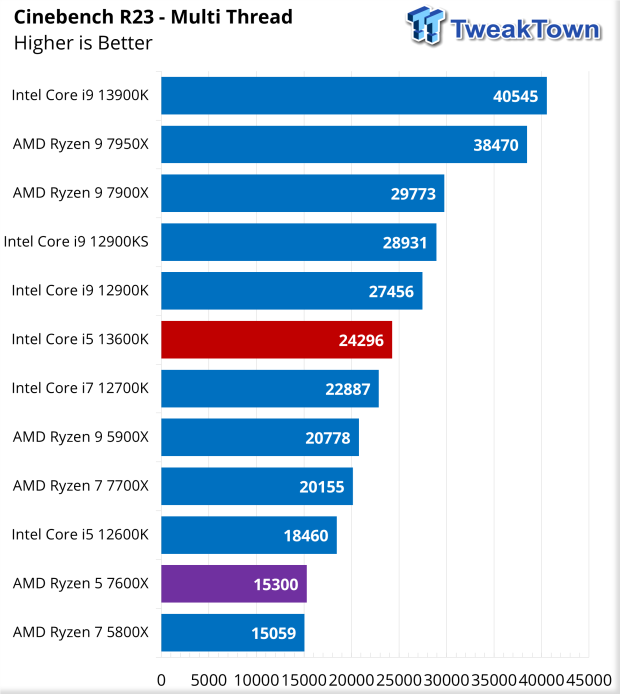
Moving to multi-thread, the 13600K scored 24296, putting it over the 7600X and 7700X.
Crossmark
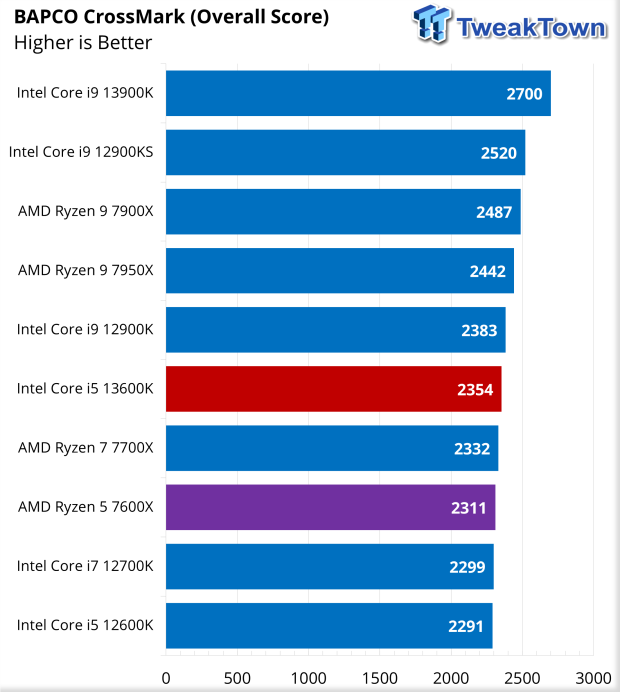
CrossMark put the 13600K, once again, in front of both the 7600X and 7700X with a score of 2354.
AIDA64
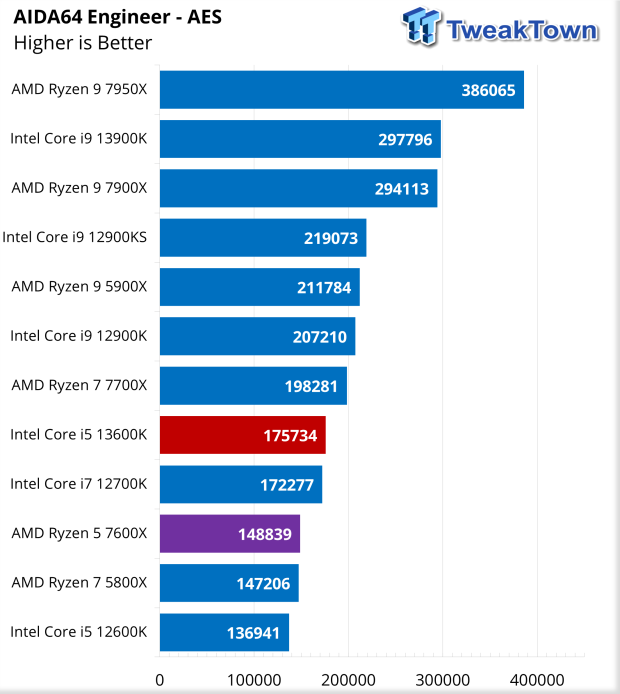
AES offered a score of 175734 for the 13600K.
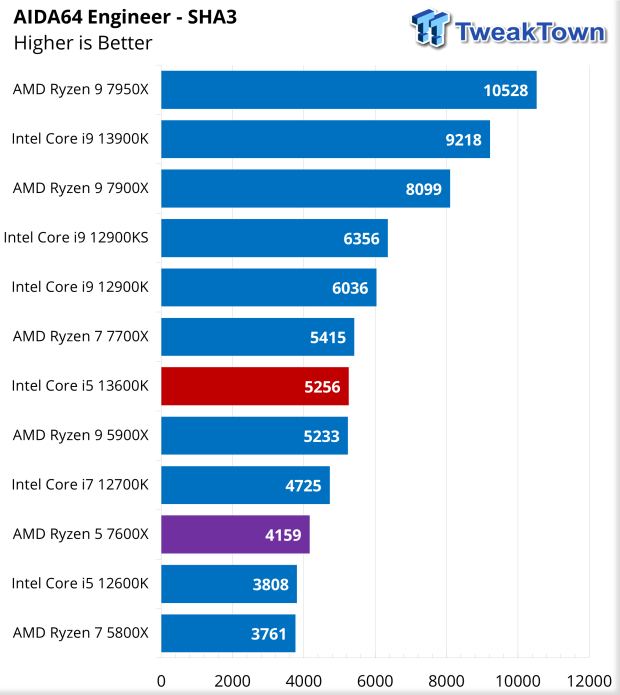
SHA3 landed the 13600K just below the 7700X, with the score landing at 5256.
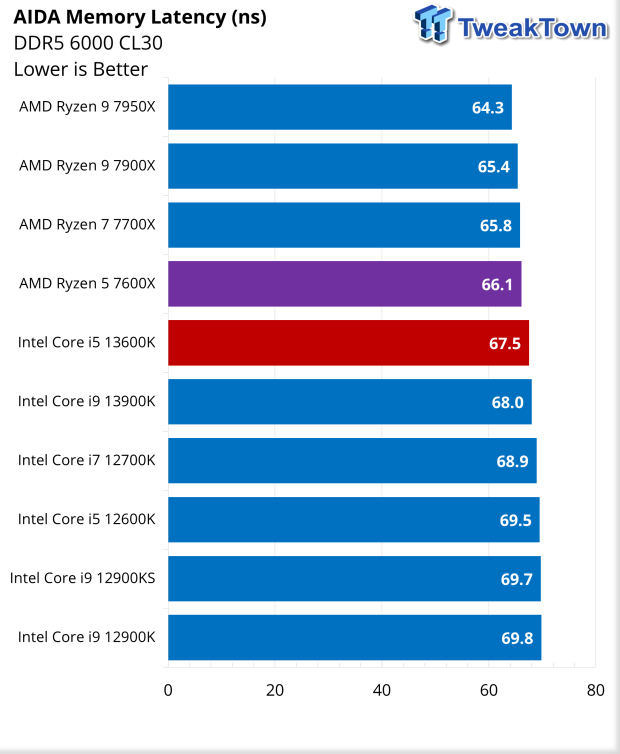
Testing memory over the last few generations, it's very apparent that bandwidth really doesn't matter past a certain point if it's slow to react. Latency of 13600K with our kit of Dominators landed at 67.5ns using XMP settings.
WEBXPRT4 and UL Benchmarks
WebXPRT4, Procyon, and 3DMark
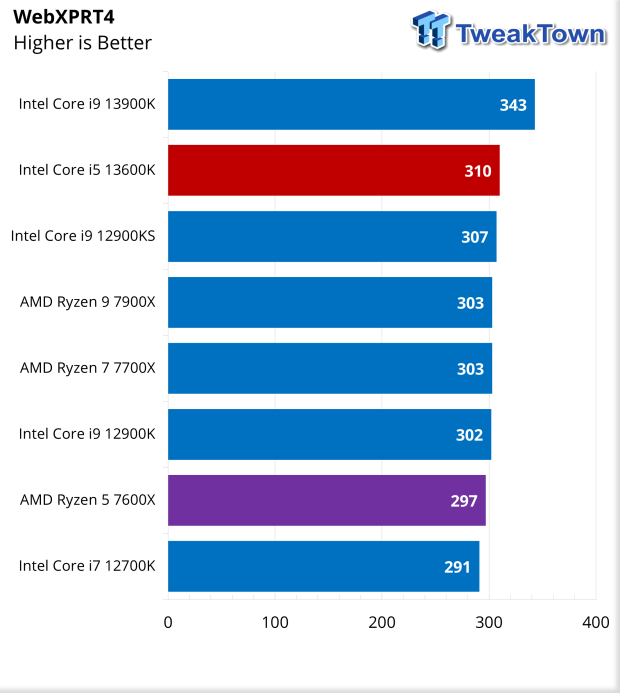
Getting into more real-world workloads, we ran the 13600K through WebXPRT4 alongside some of its closest competitors. The 13600K pulled in a score of 310, while the 7600X was at 297.
UL Procyon Suite
The UL Procyon Office Productivity Benchmark uses Microsoft Office apps to measure PC performance for office productivity work.
The Photo Editing benchmark uses Adobe® Lightroom® to import, process, and modify a selection of images. In the second part of the test, multiple edits and layer effects are applied to a photograph in Adobe® Photoshop®.
The Video editing benchmark uses Adobe® Premiere® Pro to export video project files to common formats. Each video project includes various edits, adjustments, and effects. The benchmark score is based on the time taken to export the videos.
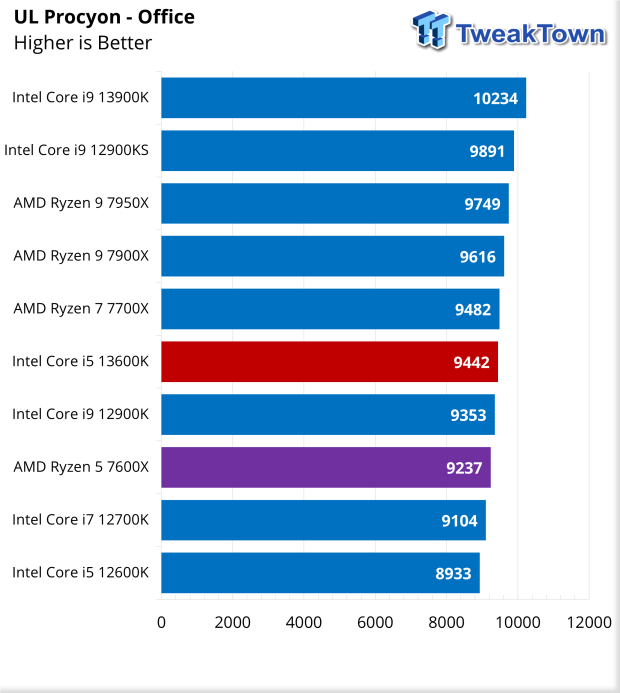
Moving into Procyon, the 13600K did well with a score of 9442.
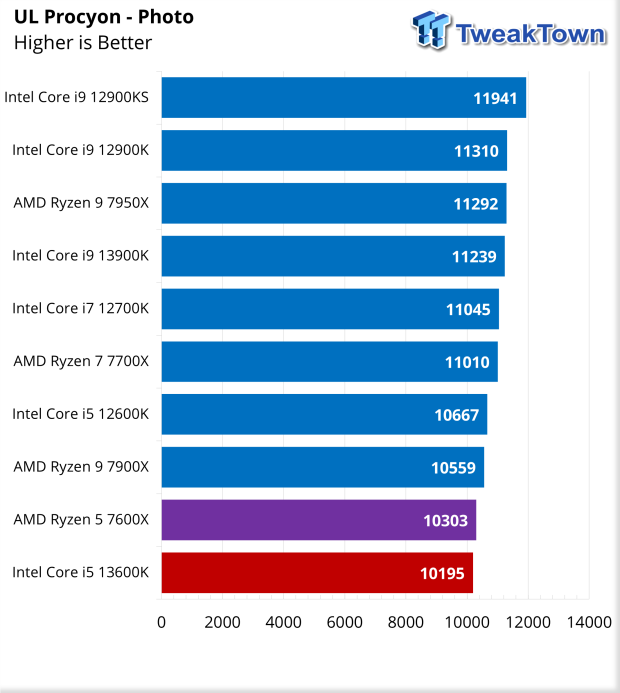
Photo scored 10195.
3DMark
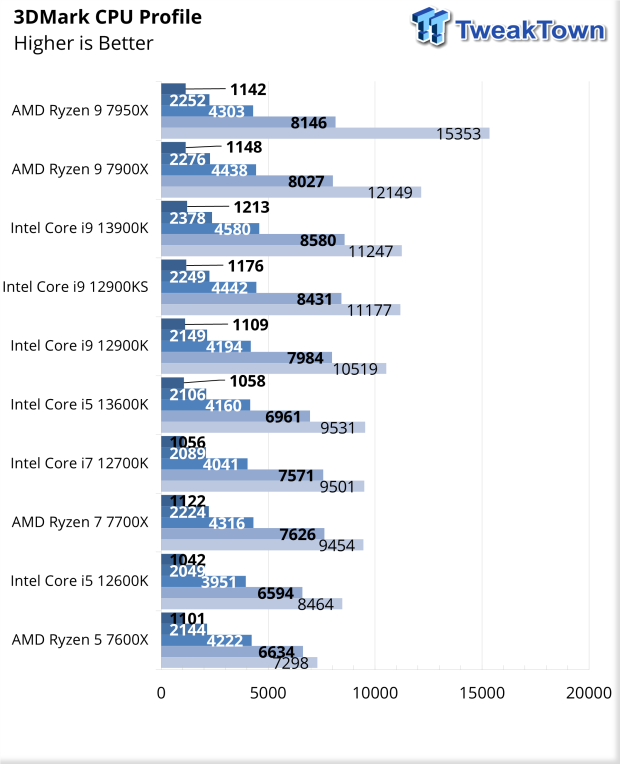
CPU Profile gave us a single thread score of 1058 and a sixteen thread score of 9531. This put the 13600K just over the 12700K, along with the 7700X and 7600X.
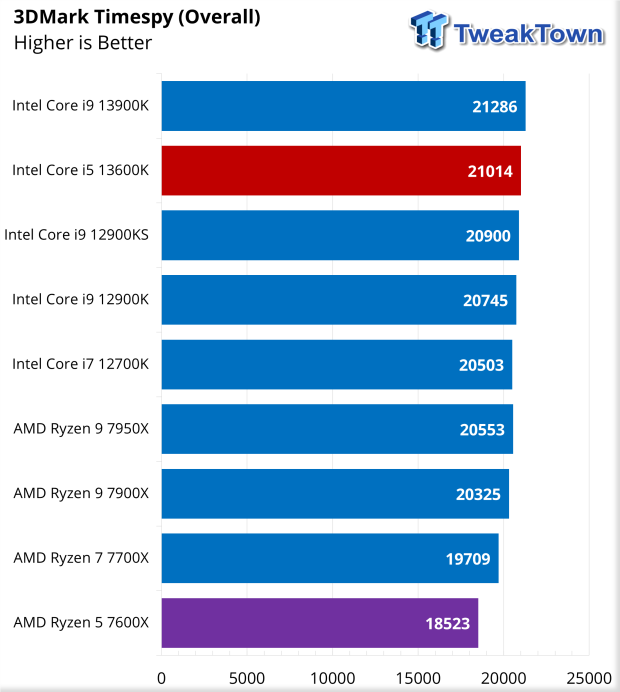
Our first "gaming" scenario is Timespy. This landed us an overall score of 21014, second to the 13900K.
Gaming and Power Consumption
Gaming Performance
Diving into gaming, we added a few new games to our list, including AC Odyssey and Forza. We kept CyberPunk as we have been using it with our 12900KS on motherboard reviews, so we have a decent comparison.
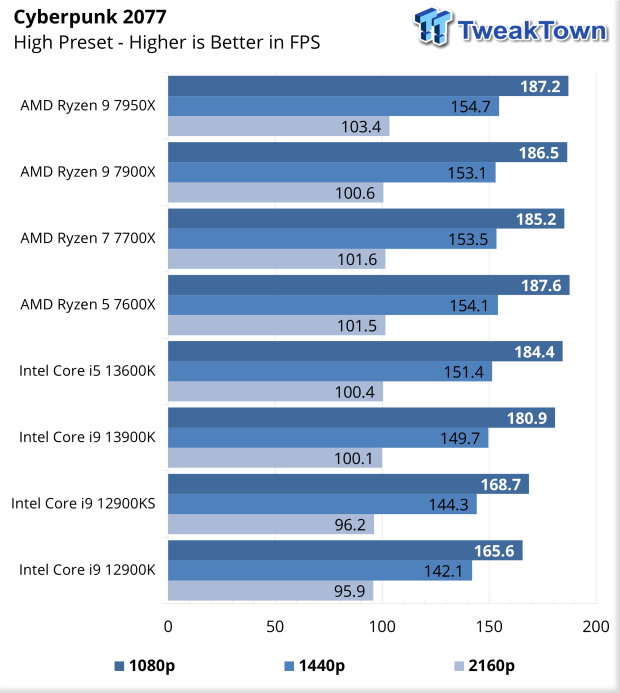
Starting with CyberPunk, the 13600K enjoyed 184 FPS at 1080p, reduced to 151 FPS at 1440p and 100 FPS at 4K.
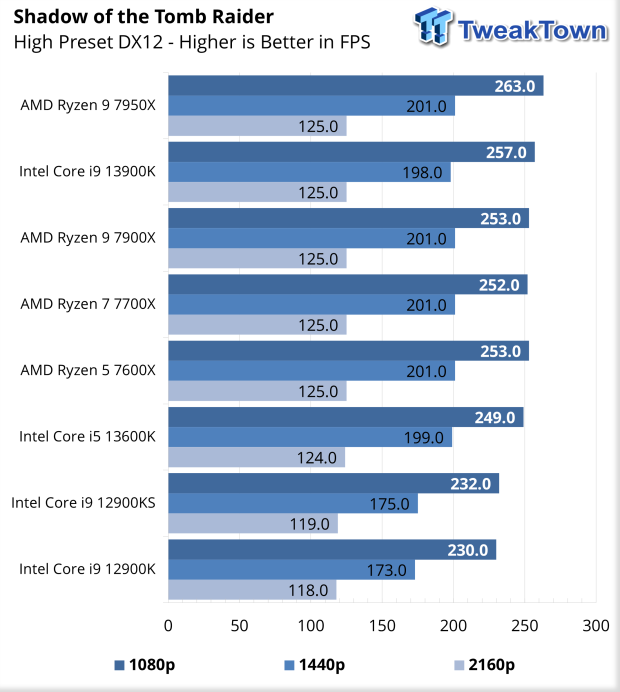
Tomb Raider pushed 249 FPS at 1080p and 199 FPS at 1440p.
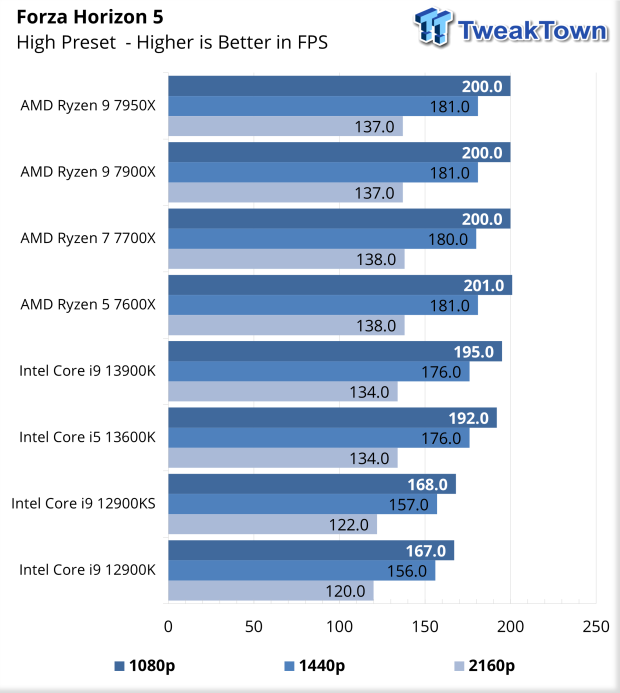
Horizon 5 landed 192 FPS peak at 1080p while 1440p offered 176 FPS.
Power Consumption
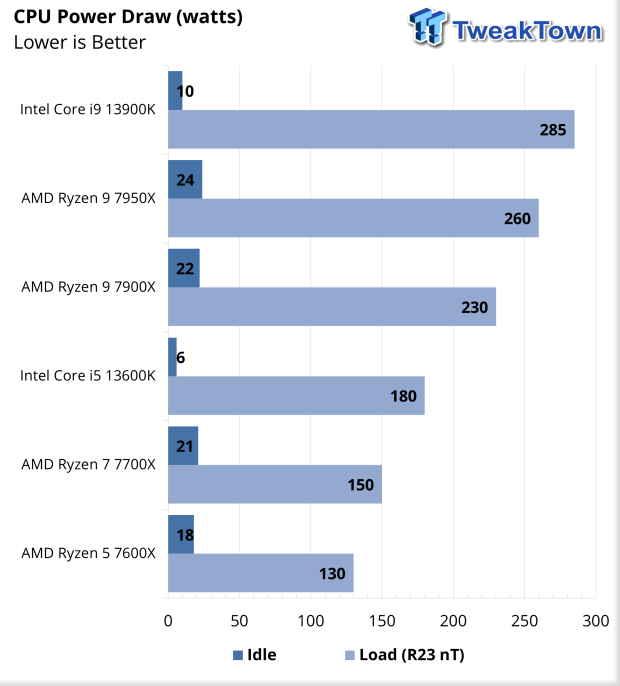
As we saw with the 13900K, the 13th Gen has made huge strides in power efficiency. For the 13600K, we measured a peak power draw of 180 watts and idle power at 6 watts.
Value and Final Thoughts
Value
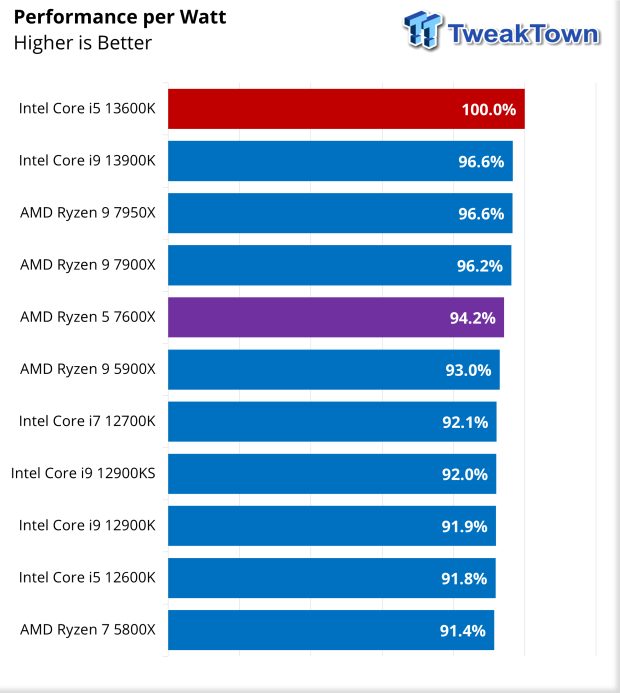
Looking at Performance per Watt, the 13600K takes the crown from the flagship 13900K. This puts it about 6% better than the 7600X.
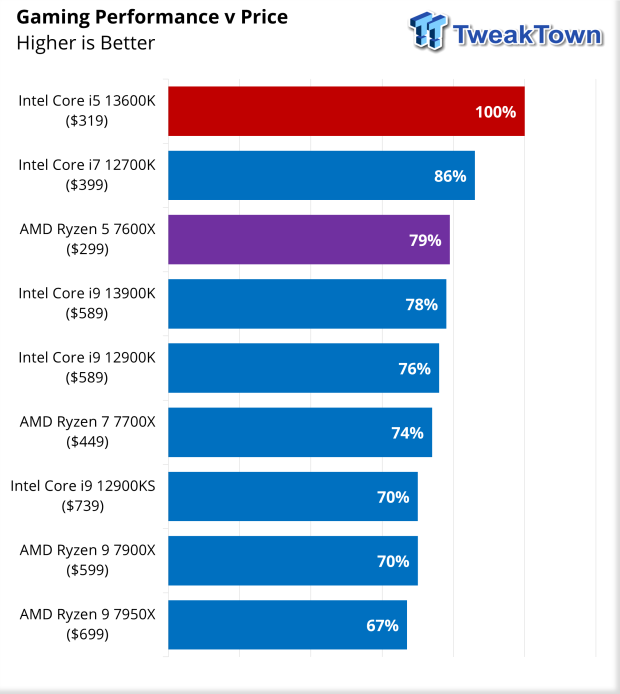
Looking at the performance across all gaming workloads, the 13600K lands at the top of our chart again, while the 7600X is about 21% worse.
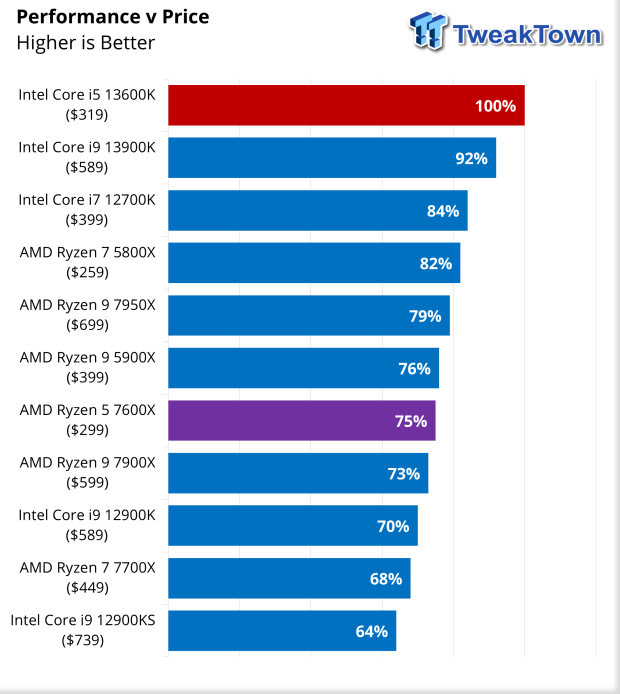
Daily workloads, the 13600K, too, takes the top spot from the 13900K.
Final Thoughts
Wrapping up our testing of 13th Gen Raptor Lake, the Core i5-13600K is perhaps even more amazing than the Core i9-13900K, in the sense that this entry-level option with a $319 MSRP is more of a direct competitor to AMD's recently launched Ryzen 7 7700X than the 7600X if we are looking at performance alone.
Dialing into performance, the 13600K did quite well in most of our testing. R23 showed solid single-thread scores of around 2000 points and multi-thread scoring of just over 24K. CrossMark pushed 2354, scoring higher than both the 7600X and 7700X. UL Testing, first with Office, landed the 13600K in line with the 7700X at ~9400 points, while Photo, in an odd turn, landed the 13600K dead last in our charts.
Pushing into gaming, the 13600K was a beast, pulling close to the same frame rates as the 13900K in Tomb Raider and Horizon 5. CyberPunk showed the 13600K to perform over the 13900K by 4 FPS at 1080p and matched 100 FPS at 4K.
As we discussed above, power efficiency is a huge factor for the 13th Gen, and the 13600K benefits by becoming the best CPU in our performance-per-watt testing, with the 13900K trailing right behind, and this carries on to our Performance vs. Price with gaming and productivity, taking the top spot in our charts.


